This post explains how to produce a report that spans multiple tables and traverses multiple joins within ArcGIS Online (AGOL). The approach uses the Get & Transform capabilities within Excel to retrieve data from the AGOL REST API, format data columns such as dates, establish relationships between tables, and finally produce tabular reports that combine related data from multiple tables. As Get & Transform uses Power Query / M Code and Power Pivot - this approach would work just as well within Power BI, but I'll use Excel as it is ubiquitous and can generally be distributed to clients and colleagues without them needing any additional software licenses.
My data model within ArcGIS Online is really pretty straight forward:
I want to produce a report that lists all the documents that have been produced within the last month, together with the Consultations thay are associated with, grouped by Local Authority. I also want to provide a hyperlink to download any attached documents. Unfortunately, although all the tables are organised like this in ArcGIS Online, it isn't possible to produce a report like this using the ArcGIS Online tools.
Retrieving Data with the ArcGIS REST API
Once you have signed into to ArcGIS Online ESRI do a good job at making it easy to retrieve data via REST web service. This can be found from any AGOL Feature Layer description page - click on the 'Service URL' link to navigate to the 'ArcGIS REST Services Directory' page which provides a listing of the layer (or table), including a list of its attributes. At the bottom of the page are links to other facilities, including querying. The Query page provides a tool to develop your REST query - to retrieve all records, just use Where 'ObjectID > 0'. Enter the names of the fields you want ('*' for all fields), Return Geometry 'False', and, lower down the form, Format: 'JSON':
Click the 'Query (Get)' button at the bottom of the form to display the Json results in a new page. You can experiment with the Query page until you get the results from that layer/table that you need. Note that I find it generally easier to retrieve all the records from each table and filter within Excel later.
What we need from this is the query string which is the URL displayed in the address bar of the results page, which will look something like this:
https://services8.arcgis.com/Wif5oK98hfZbI4/arcgis/rest/services/Development_Plan_Monitoring/FeatureServer/1/query?where=OBJECTID+%3E+0&objectIds=&time=&geometry=&geometryType=esriGeometryEnvelope&inSR=&spatialRel=esriSpatialRelIntersects&resultType=none&distance=0.0&units=esriSRUnit_Meter&returnGeodetic=false&outFields=*&returnHiddenFields=false&returnGeometry=false&returnCentroid=false&featureEncoding=esriDefault&multipatchOption=xyFootprint&maxAllowableOffset=&geometryPrecision=&outSR=&datumTransformation=&applyVCSProjection=false&returnIdsOnly=false&returnUniqueIdsOnly=false&returnCountOnly=false&returnExtentOnly=false&returnQueryGeometry=false&returnDistinctValues=false&cacheHint=false&orderByFields=&groupByFieldsForStatistics=&outStatistics=&having=&resultOffset=&resultRecordCount=&returnZ=false&returnM=false&returnExceededLimitFeatures=true&quantizationParameters=&sqlFormat=none&f=pjson&token=GT-Hptd3gwqXU3oWqX4rxKLVxHDnM7qXpNUk
Now that we have a query string that retrieves the data that we want, we can use this within Excel. Note that the above query string includes a security token that was generated when you signed into AGOL. This is time-limited and we will need to address this later.
Get ArcGIS Data from Excel
Open a new Excel workbook and on the Data tab, click the 'From Web' button and paste the query URL into the URL field: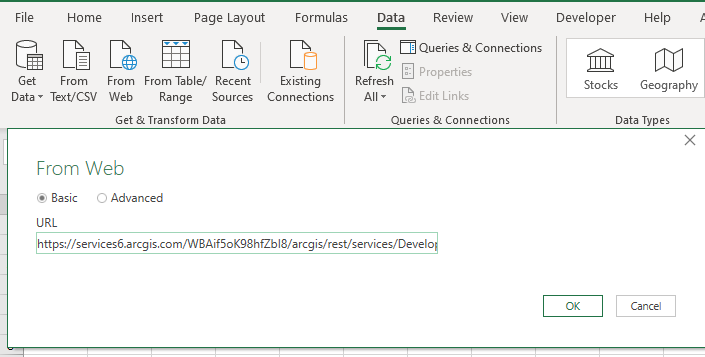
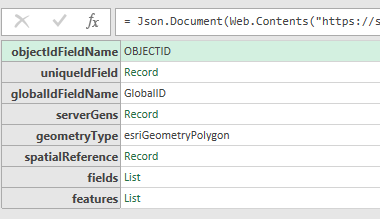
When you Click OK, the data is retrieved and presented in a preview window. Unfortunately Excel does not recognise the Json format so we will need to address that next. Ignore the data and settings and just click the 'Transform Data' button to proceed onto the Power Query Editor window.
On the right of the window you will see Query Settings panel that lists each of the steps involved in getting and transforming the data:

Select the 'Changed Type' line, right click and delete that line.
In the address bar of the Power Query window, click the down arrow to expand the box to show the query string.
Our first issue is that Excel thinks the data is in CSV format and we need to correct it to use Json. The Source line begins with:
= Csv.Document(Web.Contents("https://servicesn.arcgis.com/
change it to:
= Json.Document(Web.Contents("https://servicesn.arcgis.com/
At the end of that line, remove the:
,[Delimiter=",", Columns=2, Encoding=65001, QuoteStyle=QuoteStyle.None]
so that the line now ends with
"))
and hit Enter.
On the Trnaform ribbon, click the 'To Table Convert' button and OK to continue.
 Now click the expand button button at the top of 'Column 1'. Choose 'Select All Columns'. Unselect the 'Use original column names as prefix' option.
Now repeat the action for the expand button at the top of the new 'attributes' column.
Phew - you should now finally see a table with your data in.
If things don't work at first just delete the steps in the Query Settings windows (starting with the last step and working upwards/backwards) until you get back to a place that you are happy with and then retry.
In the 'Properties' field of the Query Settings panel - give the query/connection a meaningful name such as the ArcGIS source table name (rather than the long query string that it defaults to).
Repeat this for each of the ArcGIS/REST tables that you need for your report. Each table is loaded into a separate worksheet as Excel Tables. The data in each worksheet can be refreshed with the latest data from ArcGIS Online by clicking the 'Refresh All' button on the Data ribbon, or by right clicking on any of the Connections and selecting 'Refresh'.
Note - do not change the data structure or content in any of the resultant tables as such changes will not be picked up in the data model. If any structural changes are required (renaming columns, converting data formats, etc.) then these should be made using Power Query / M Code.
Define Relationships between Tables
When you have loaded two or more related tables it is time to establish the relationships between them. First we need to add each of the tables to the Power Pivot data model within Excel - select a worksheet containing table data and click the button for the 'Power Pivot' ribbon. Click the 'Add to Data Model' button to add the current table into the data model. Click the 'Diagram View' button to show the tables.Add other tables by clicking on their worksheet and clicking the 'Add to Data Model' button. Note that you can view the data model at anytime by clicking the 'Manage Data Model' button on the Data ribbon to launch the Power Pivot window.
Enlarge tables to show more attributes and drag tables into place relative to each other. Establishing relationships can be prickly - I have had most success by clicking on the Foreign Key attribute in the child table first and dragging the relationship line over to the Primary Key attribute in the parent table. To change the cardinality if needed, then select the relationship and click 'Manage Relationships' button on the Design ribbon of the Power Pivot window.
Add Measures
Add a 'measure' to each table in the data model. This is not intuitive but it seems to be necessary in order for Excel to respect the relationships when used later in Pivot tables. Click on any of the table worksheets and select the 'Measures' button from the 'Power Pivot' ribbon. Add New and for each table in turn add the following measure:=COUNTROWS(table name)
Give each measure a unique name.
Create Pivot Table Report
My objective here is to produce a tabular report comprising related data, much like the results of an SQL query. We can accomplish this with a Pivot Table, although we do need to 'flatten' it as we go rather than accepting the default hierarchical layout.Getting the Pivot Table format to work is fiddly, the following steps work for me.
On a new worksheet within Excel, click the 'Pivot Table' button on the Insert ribbon.

Choose the 'Use an external data source' option and hit the 'Choose Connection..' button.
Click the 'Tables' tab and select the 'Tables in workbook data model' option. Click Open and OK and access the tables.
Within the 'Pivot Table Fields' panel, you can now drag fields into the Rows area of the panel. Start with 'parent' fields and add 'child' fields to the right. The relationships that you have defined will ensure that only related records are displayed.
After adding the first field to the Pivot Table - place your cursor within the first column and, on the Analyze ribbon, click the Pivot Table Options button; on the Display tab, uncheck the 'Show expand/collapse buttons' option. On the 'Totals & Filters' tab, uncheck the two Grand Totals options.
Next click the 'Field Settings' button and on the 'Layout & Print' tab choose the 'Show item labels in tabular form' and 'Repeat item labels' options. Repeat this step after adding each row.
Add a Value field to the Pivot Table - select a unique value field from a child table and add that to the Pivot Table Values eg 'Count of GlobalID'
On the Design ribbon, click the 'Report layout' button and choose 'Show in Tabular Form' option to add data filters on each column. On the first column it may be necessary to add a data filter to remove 'blanks'.
Congratulations you should now have a Pivot table report made up from data from related tables.
Other Considerations
The above steps should have produced a basic Pivot Table report; there are several other steps that may be needed:- Reformat ArcGIS Unix dates
- Facility to refresh ArcGIS/REST/OAuth2 security token
- Hyperlink to download attached documents
Reformat ArcGIS Unix Dates
ArcGIS returns datetime values in Unix format which looks like this "1574790297103". We need to reformat this data into something useful as the date is brought through Power Query. Within the Power Query Editor, click the 'Advanced Editor' button to display the M code. Each line of code structures the data sequentially.I included a couple of lines at the end of this code block for each datetime field that I need to reformat:
let
...
#"Added Doc_Date" = Table.AddColumn(#"Renamed Columns", "Doc_Date", each
#date(1970,1,1)+#duration(0,0,0,[DOCUMENT_DATE]/1000)),
#"Changed Type" = Table.TransformColumnTypes(#"Added Doc_Date",{{"Doc_Date",
type date}})
in
#"Changed Type"
Refresh Security Token
The security token used within the query string above will expire and therefore we need a way to obtain new security tokens as conveniently as possible. The steps are:- Register an ArcGIS application and use Client ID and Client Secret to obtain new tokens
- Create an Excel table to hold token information
- Update the Excel Power Query M code to obtain tokens when required
The query string to obtain a new token will look like this:
https://www.arcgis.com/sharing/rest/oauth2/token?client_id=gh34g3h4g34g&client_secret=gg43hg4h4g3g&grant_type=client_credentials&f=pjson
On a new worksheet within your Excel workbook, follow the steps to Get Data From the Web (ie a new token) using this URL with your client information. Store the token information in a table. I have set my version up in a way that a new token is only obtained if it is needed - by default tokens are time-limited to 28800 seconds (8 hours). I work when when my new token will expire and store that information in my Excel token table (tblToken).
Perhaps the quickest way for you to implment this approach would be to click on the 'Advanced Editor' button in the Power Query Editor. Take a copy of the few lines of code that are displayed and replace it with this M code:
let
// retrieve datetime that current ArcGIS token expires
Expires = DateTime.From(Excel.CurrentWorkbook(){[Name="tblToken"]}[Content]{0}[expires_at]),
Existing_Source = Excel.CurrentWorkbook(){[Name="tblToken"]}[Content],
Output = if DateTime.LocalNow() > Expires then
let
New_Source = Json.Document(Web.Contents("https://www.arcgis.com/sharing/rest/oauth2/token?client_id=gg4gg3&client_secret=g43hg434g&grant_type=client_credentials&f=pjson&expiration=480")),
#"Converted to Table" = Record.ToTable(New_Source),
#"Transposed Table" = Table.Transpose(#"Converted to Table"),
#"Promoted Headers" = Table.PromoteHeaders(#"Transposed Table", [PromoteAllScalars=true]),
#"Changed Type" = Table.TransformColumnTypes(#"Promoted Headers",{{"access_token", type text}, {"expires_in", Int64.Type}}),
#"Added Custom" = Table.AddColumn(#"Changed Type", "expires_at", each DateTime.LocalNow() + #duration(0,0,0,[expires_in]))
in
#"Added Custom"
else
let
#"Changed Type" = Table.TransformColumnTypes(Existing_Source,{{"access_token", type text}, {"expires_in", Int64.Type}, {"expires_at", type datetime}})
in
#"Changed Type"
in
Output
This M code first checks the existing token to see if it is still valid and if not, it gets a new token and stores it in tblToken. The #"Added Custom" line adds a table column to hold the datetime that the token expires and converts the date format into something recognisable and stores it in the new column.
Each of the existing table connections now need to be revised to take advantage of the new tokens. The key changes are illustrated by the following lines of M code within the Excel Power Query Advanced Editor for each table connection:
let
Param1 = Text.From(Excel.CurrentWorkbook(){[Name="tblToken"]}[Content]{0}[access_token]),
Source = Json.Document(Web.Contents("https://servicesn.arcgis.com/WTif5oK98hfZbI8/arcgis/rest/services/Development_Plan_Monitoring/FeatureServer/3/query?where=objectid+3%E+0&objectIds=&time=&resultType=none&outFields=*&returnHiddenFields=false&returnIdsOnly=false&returnUniqueIdsOnly=false&returnCountOnly=false&returnDistinctValues=false&cacheHint=false&orderByFields=&groupByFieldsForStatistics=&outStatistics=&having=&resultOffset=&resultRecordCount=&sqlFormat=none&f=pjson&token=" & Param1)),
features = Source[features],
The M code picks up the access token directly from the Excel tblToken table, stores it in a parameter and appends that parameter to the query string.
Hyperlink to Download ArcGIS Attached Documents
The final part of my puzzle is to provide a link within the Pivot Table report to open/download attached docuements. Now whilst I have an approach that works, it isn't great as it requires that the entire hyperlink is displayed in the report table. Attempts to create more user freindly hyperlinks in which the actual URL is hidden behind the document name haven't been successful yet.A link to an ArcGIS attached document looks like this:
https://servicesn.arcgis.com/WTif5oK98hfZbI8/arcgis/rest/services/Development_Plan_Monitoring/FeatureServer/2/2382/attachments/2423?token=Sy7vbOQJ_kx93vjMz4jv_LPkpKKUeY85BdS_3vCFox7LW1ZI
The URL includes an access token, so the current valid token needs to be appended to the URL to enable access to the document. This steps is performed within the M code each time the table connection is refreshed:
let
Param1 = Text.From(Excel.CurrentWorkbook(){[Name="tblToken"]}[Content]{0}[access_token]),
...
#"Added Custom" = Table.AddColumn(#"Expanded attachmentInfos1", "Web Link", each [url] & "?token=" & Param1)
in
#"Added Custom"
This creates a hyperlink to the attached document. In order to make the myperlink 'clickable' within the Pivot Table we need to add a little bit of VBA code from the Excel Developer tab (Alt + F11 from the Report worksheet):
Private Sub Worksheet_SelectionChange(ByVal Target As Range)
  'Make Hyperlink in Pivot Table clickable
  'https://www.extendoffice.com/documents/excel/1961-excel-pivot-table-display-hyperlink.html
  If Target.Cells.Count <> 1 Then Exit Sub
  On Error Resume Next
  Application.ActiveWorkbook.FollowHyperlink Address:=CStr(Target.Value), NewWindow:=True
End Sub
I hope that is helpful to ArcGIS Online users and other REST API users. If you spot any improvements please leave a comment below.


